Descriptive statistics are a fundamental part of data analysis used to summarize and describe the main features of a dataset. They provide simple summaries of the sample and the observations made.
Here are some key concepts in descriptive statistics:
Measures of Central Tendency
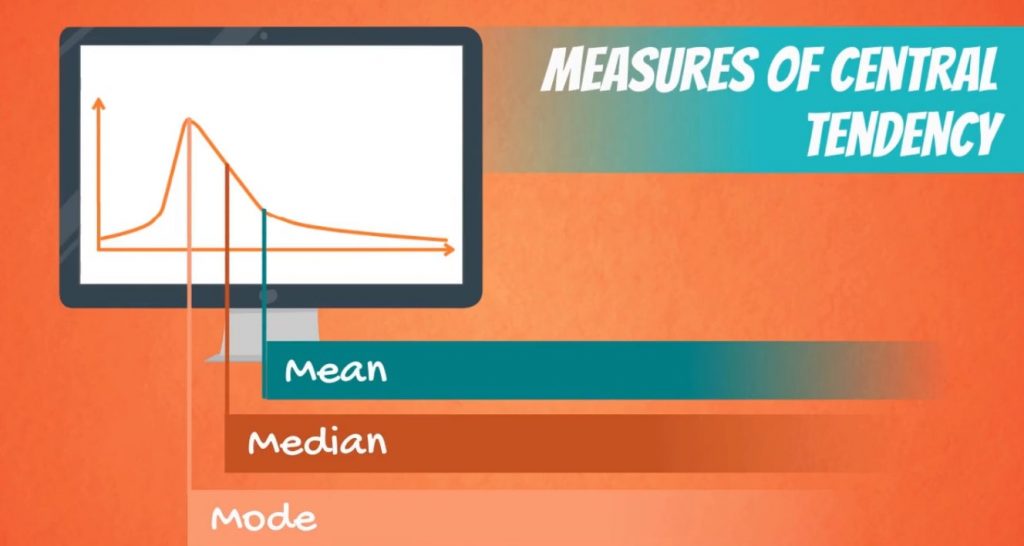
Mean: The average value of a dataset, is calculated by summing all values and dividing by the number of observations.
Median: The middle value in a dataset when arranged in ascending or descending order. It’s less affected by extreme values (outliers) compared to the mean.
Mode: The most frequent value(s) in a dataset.
Measures of Dispersion/Variability
Range: The difference between the maximum and minimum values in a dataset, providing a quick idea of the spread.
Variance: A measure of how spread out the values in a dataset is around the mean.
Standard Deviation: The square root of the variance, measuring the average distance of values from the mean.
Interquartile Range (IQR): The range between the first quartile (25th percentile) and the third quartile (75th percentile), is useful for identifying the spread of the middle 50% of the data.
Skewness: Measures the asymmetry of the distribution. A skewness of zero indicates a symmetric distribution.
Kurtosis: Measures the “peakedness” or “flatness” of a distribution. High kurtosis indicates a sharper peak around the mean compared to a normal distribution.
Frequency Distributions

Histograms: Graphical representations of frequency distributions, displaying the distribution of values in intervals (bins).
Frequency Tables: Tabular summaries showing the number of occurrences of each value or range of values in a dataset.
Correlation
Correlation Coefficient: Measures the strength and direction of the linear relationship between two variables. It ranges from -1 to 1, where -1 indicates a perfect negative linear relationship, 1 indicates a perfect positive linear relationship, and 0 indicates no linear relationship.
These descriptive statistics help in understanding the basic properties of a dataset, allowing analysts to draw initial insights, identify patterns, detect outliers, and decide on appropriate further analyses or modeling techniques.
When performing descriptive statistics, it’s crucial to understand the context of the data, check for outliers, and consider the limitations of summary statistics, as they may not capture all aspects of the underlying data distribution. Visualizations like histograms, box plots, and scatter plots can complement descriptive statistics in providing a more comprehensive understanding of the data.


Leave a Reply